Gridded satellite observations and statistics
Once satellite observations are retrieved or even collocated model data are available wavy can display this data in custom grids for your region of interest.
Gridding of satellite observations
Retrieve satellite observations from multiple satellites:
>>> from wavy.satellite_module import satellite_class as sc
>>> path = '/home/patrikb/wavy/tests/data/L3/s3a/'
>>> sd = '2022-2-1'
>>> ed = '2022-2-2'
>>> region = 'global'
>>> name = 's3a'
>>> nID = 'cmems_L3_NRT'
>>> sco = sc(sd=sd,ed=ed,region=region,nID=nID,name=name).populate(path=path)
Apply the gridder:
>>> from wavy.gridder_module import gridder_class as gc
>>> from wavy.grid_stats import apply_metric
>>> bb = (-179, 178, -80, 80)  # lonmin,lonmax,latmin,latmax
>>> res = (5, 5) # lon/lat
>>> gco = gc(oco=sco,bb=bb,res=res)
>>> gridvar, lon_grid, lat_grid = apply_metric(gco=gco)
>>> gco.quicklook(val_grid=gridvar,
...               lon_grid=lon_grid,
...               lat_grid=lat_grid,
...               metric='mor', land_mask_resolution='i',
...               mask_metric_llim=1,
...               title='')
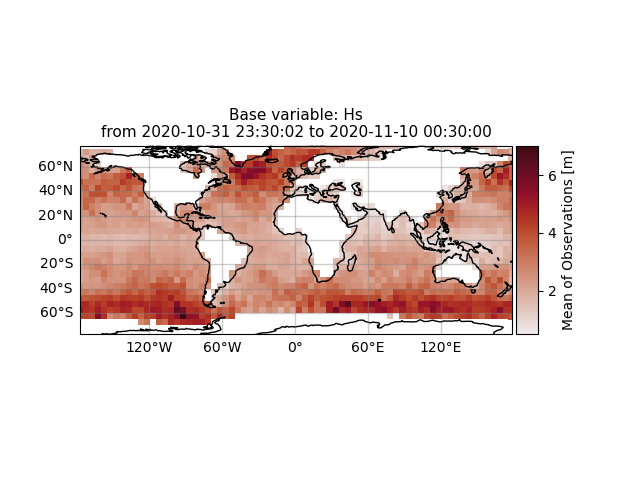
Information of the grid and the values from observations and model can also be obtained directly from the gridder_class object:
>>> ovals,mvals,Midx = gco.get_obs_grid_idx()
ovals represent observation values, mvals are model values, and Midx is the matrix of indices. mvals is empty since no model values have been retrieved yet.
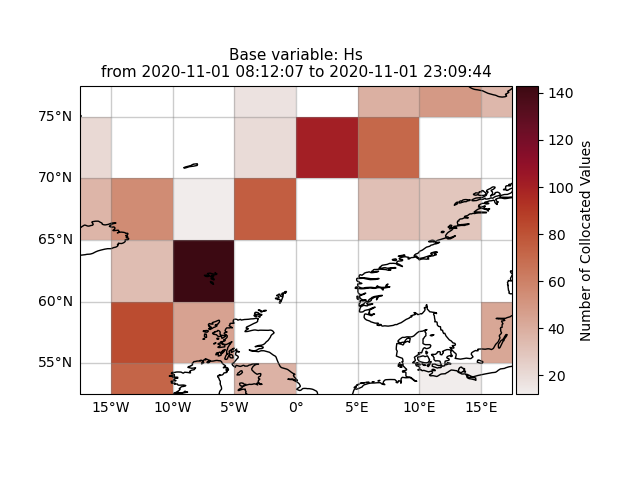
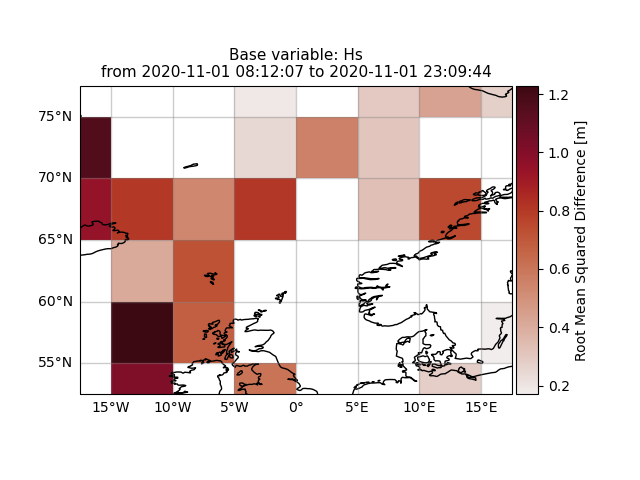
Gridding of collocated data
We first need to collocate the data with the collocation_class
>>> from wavy.collocation_module import collocation_class as cc
>>> # collocate
>>> cco = cc(model='ww3_4km',oco=sco,distlim=6,leadtime='best').populate()
>>> # reduce region to part of model domain for better visual
>>> bb = (-20,20,50,80) # lonmin,lonmax,latmin,latmax
>>> res = (5,5) # lon/lat
>>> gco = gc(cco=cco,bb=bb,res=res)
>>> var_gridded_dict,lon_grid,lat_grid = apply_metric(gco=gco)
>>> # plot all validation metrics on grid
>>> gco.quicklook(val_grid=var_gridded_dict,lon_grid=lon_grid,lat_grid=lat_grid,metric='all')
|
|