Follow storm track
In some occasion it is practical to follow a storm when retrieving satellite information. wavy can do so which is shown in the following with an example on the hurricane track of Katrina until landfall.
Open python in the wavy conda environment:
$ conda activate wavy
$ python
Define a track file that could look like the following csv file. It has to include a column called “lat” and one called “lon”:
date,lat,lon,Pmb,Ukt,CAT
2005-08-23 18,23.05,-75.01,1008,30,TD
2005-08-24 00,23.38,-75.64,1007,30,TD
2005-08-24 06,23.76,-76.20,1007,30,TD
2005-08-24 12,24.46,-76.50,1006,35,TS
2005-08-24 18,25.36,-76.88,1003,40,TS
2005-08-25 00,25.80,-77.70,1000,45,TS
2005-08-25 06,26.06,-78.36,997,50,TS
2005-08-25 12,26.18,-78.95,994,55,TS
2005-08-25 18,26.15,-79.56,988,60,TS
2005-08-25 22,26.00,-80.10,984,70,H1
2005-08-26 00,25.88,-80.28,983,70,H1
2005-08-26 06,25.35,-81.27,987,65,H1
2005-08-26 12,25.05,-81.96,979,75,H1
2005-08-26 18,24.87,-82.61,968,85,H2
2005-08-27 00,24.56,-83.29,959,90,H2
2005-08-27 06,24.37,-83.98,950,95,H2
2005-08-27 12,24.36,-84.68,942,100,H3
2005-08-27 18,24.49,-85.28,948,100,H3
2005-08-28 00,24.77,-85.89,941,100,H3
2005-08-28 06,25.15,-86.69,930,125,H4
2005-08-28 12,25.68,-87.70,909,145,H5
2005-08-28 18,26.25,-88.61,902,150,H5
2005-08-29 00,27.16,-89.20,905,140,H5
2005-08-29 06,28.15,-89.62,913,125,H4
2005-08-29 11,29.27,-89.61,920,110,H3
2005-08-29 12,29.50,-89.59,923,110,H3
2005-08-29 14,30.18,-89.57,928,105,H3
This track is retrieved from https://coast.noaa.gov/hurricanes. Save this example under Katrina_track.csv.
Download the respective satellite files:
./wavyDownload.py -sat multi -sd 2005082312 -ed 2005083000 -product cci_L3
Now start you python script:
# imports
>>> from wavy.satellite_module import satellite_class as sc
>>> from wavy.insitu_module import poi_class as pc
>>> from wavy.utils import parse_date
>>> import pandas as pd
>>> f = pd.read_csv('/path/to/your/wavy/tests/data/track/Katrina_track.csv')
>>> # convert dates to datetime
>>> dt = [parse_date(d) for d in f.date]
>>> lons = f.lon.values
>>> lats = f.lat.values
>>> # define poi dictionary for track
>>> poi_dict = {'time':dt,'lons':lons,'lats':lats}
>>> # initialize poi class object
>>> pco = pc(poi_dict, nID='Katrina', name='Katrina', varalias='Hs')
>>> # retrievals
>>> sco = sc(twin=180, distlim=200, name='multi',
... nID='CCIv1_L3', region='global',
... varalias = 'Hs', # default
... poi=pco)
>>> sco = sco.populate(path='/path/to/your/wavy/tests/data/L3/multi/')
>>> # quicklook including track by passing poi
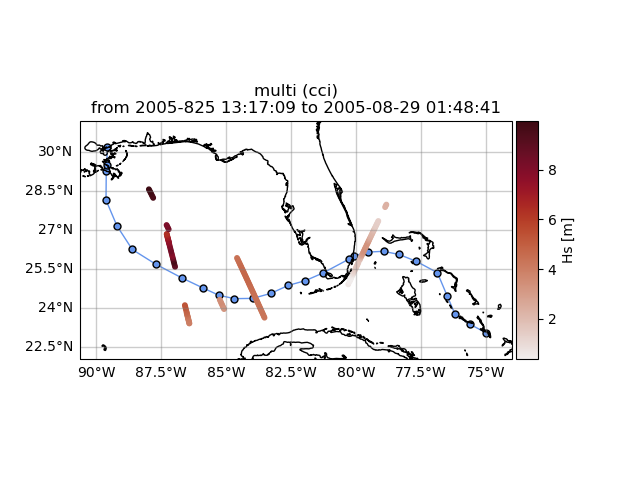
>>> sco.quicklook(m=True,poi=pco)
This script gathers all footprints within a 200km radius and a +-180min time window given time and location of tracked storm. Executing yields the following figure: