Quick look examples with wavyQuick
The script “wavyQuick.py” is designed to provide quick and easy access to information regarding satellite coverage and basic validation. Checkout the help:
$ cd ~/wavy/apps/standalone
$ ./wavyQuick.py -h
Browsing for satellite data of a given satellite mission and show footprints on map for a given time step and region:
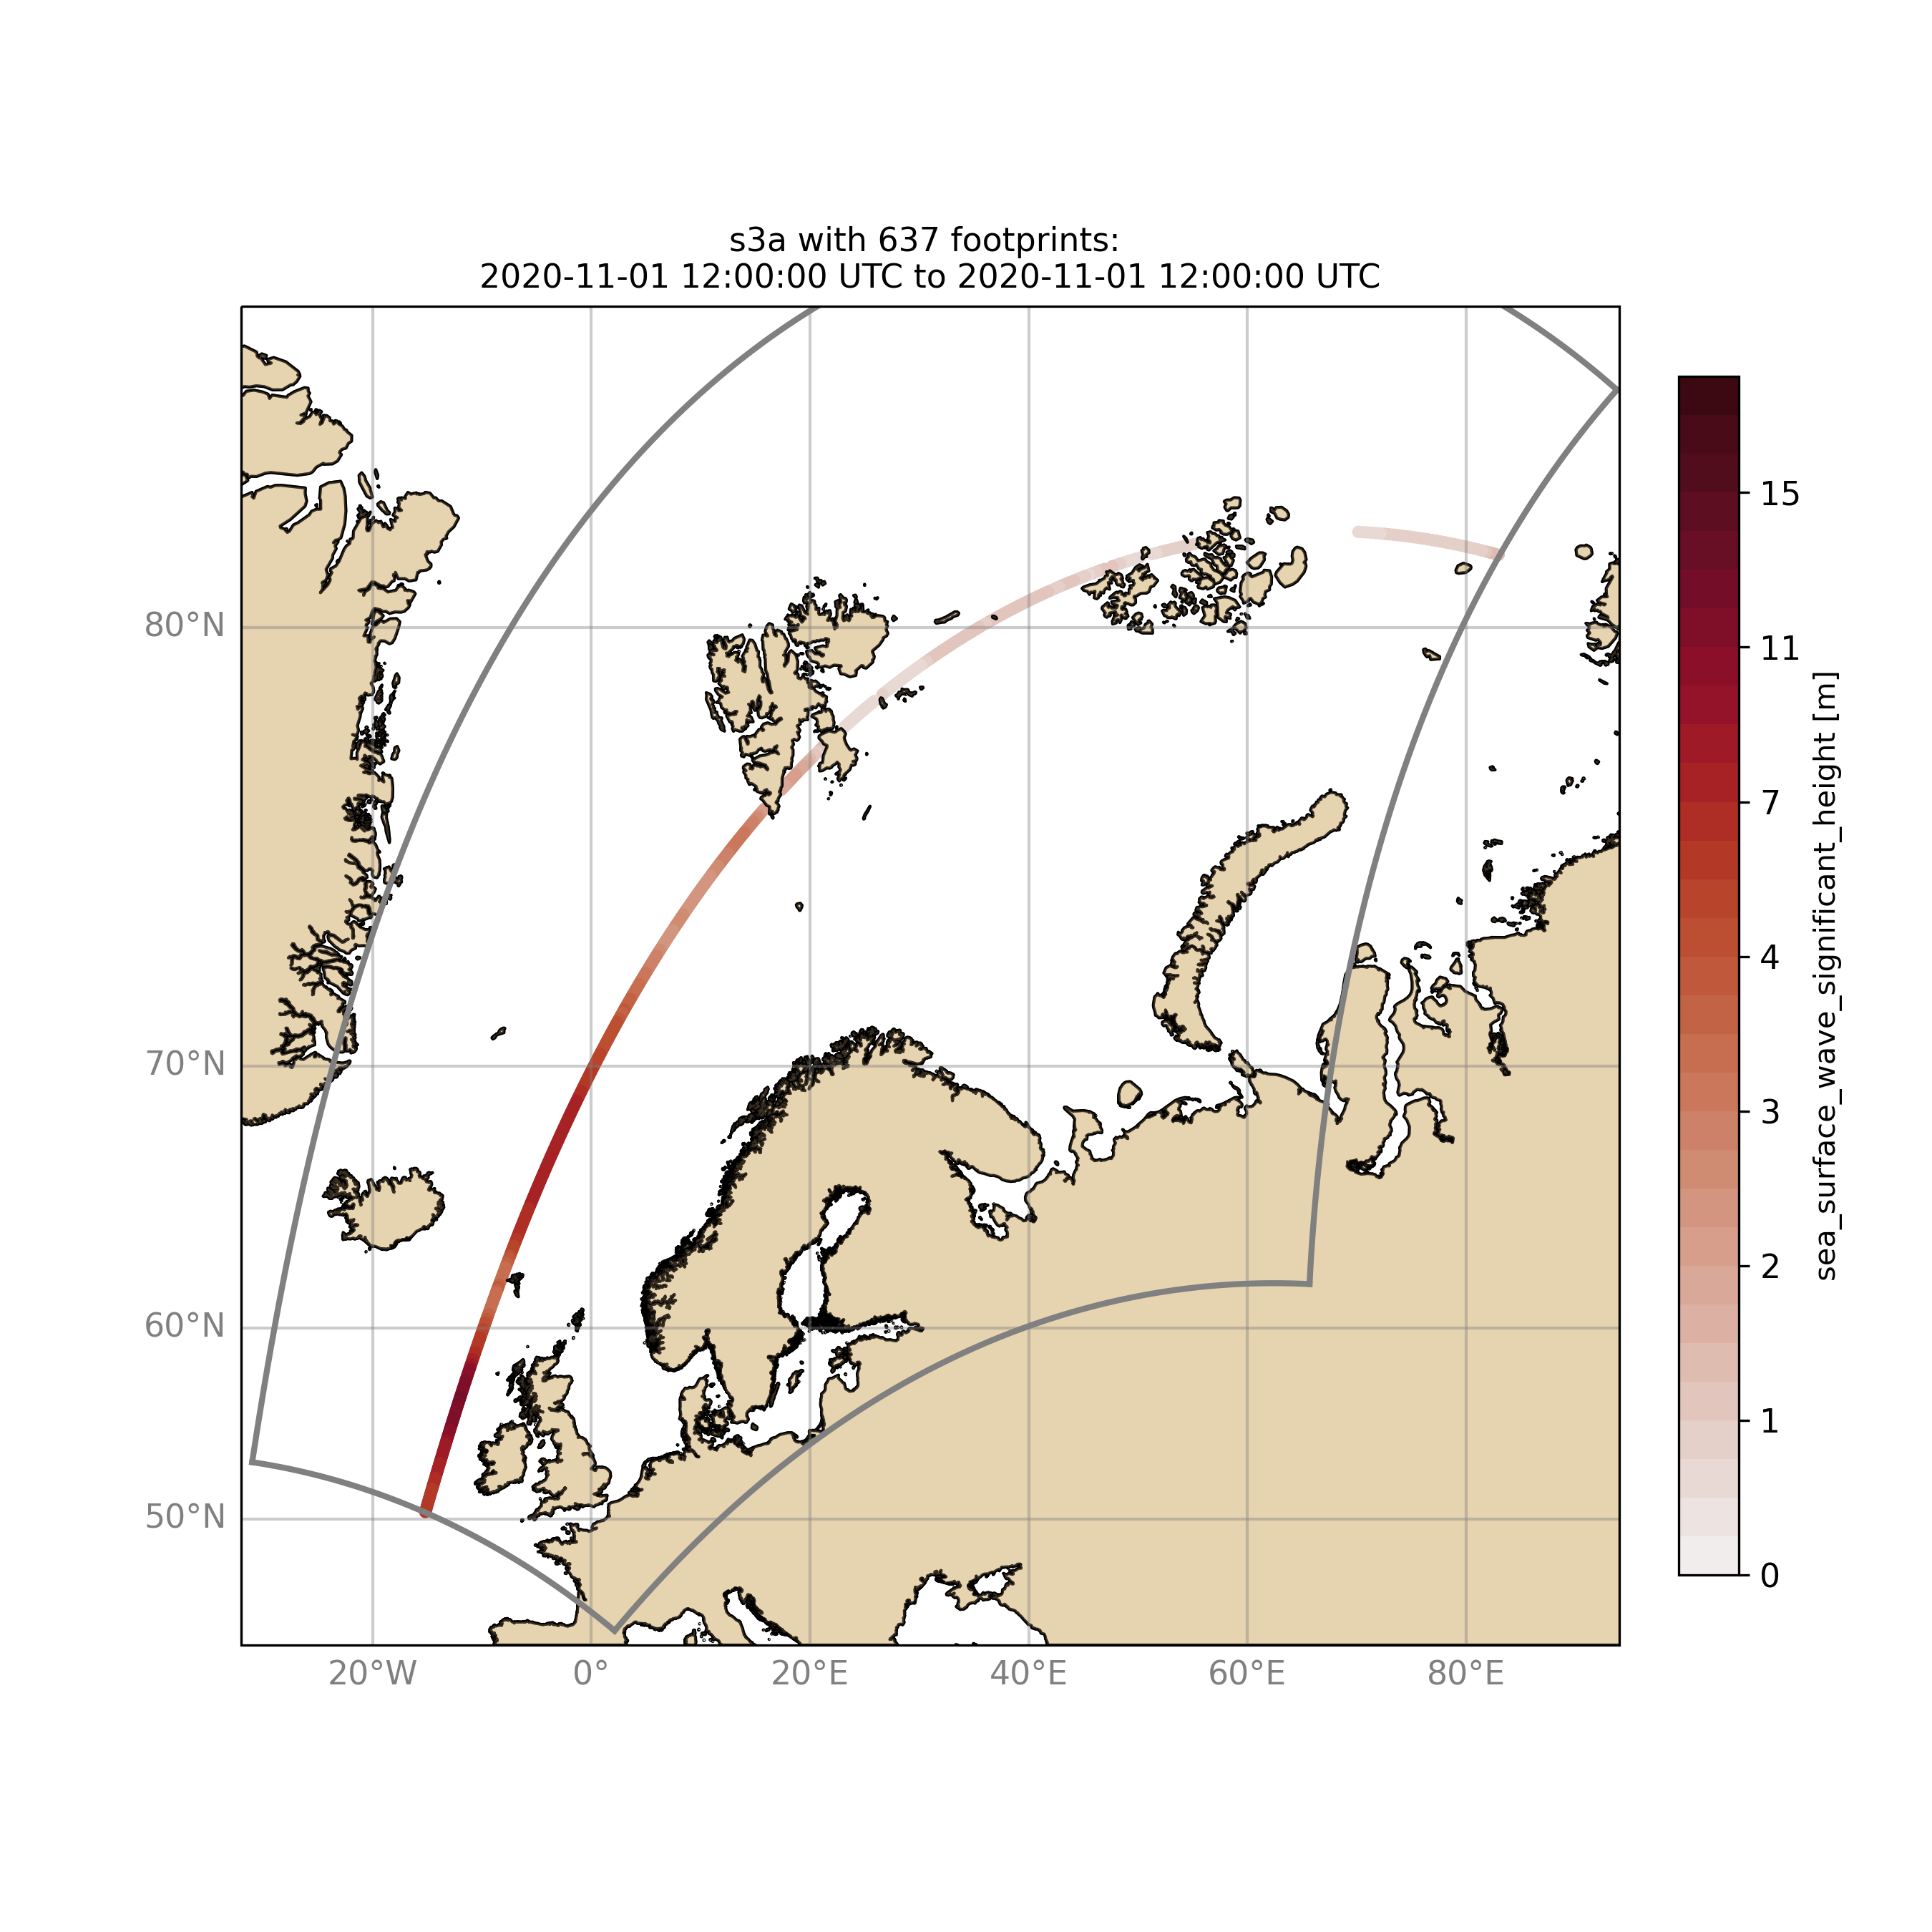
For a model domain, here mwam4
$ ./wavyQuick.py -sat s3a -reg mwam4 -sd 2020110112 --show
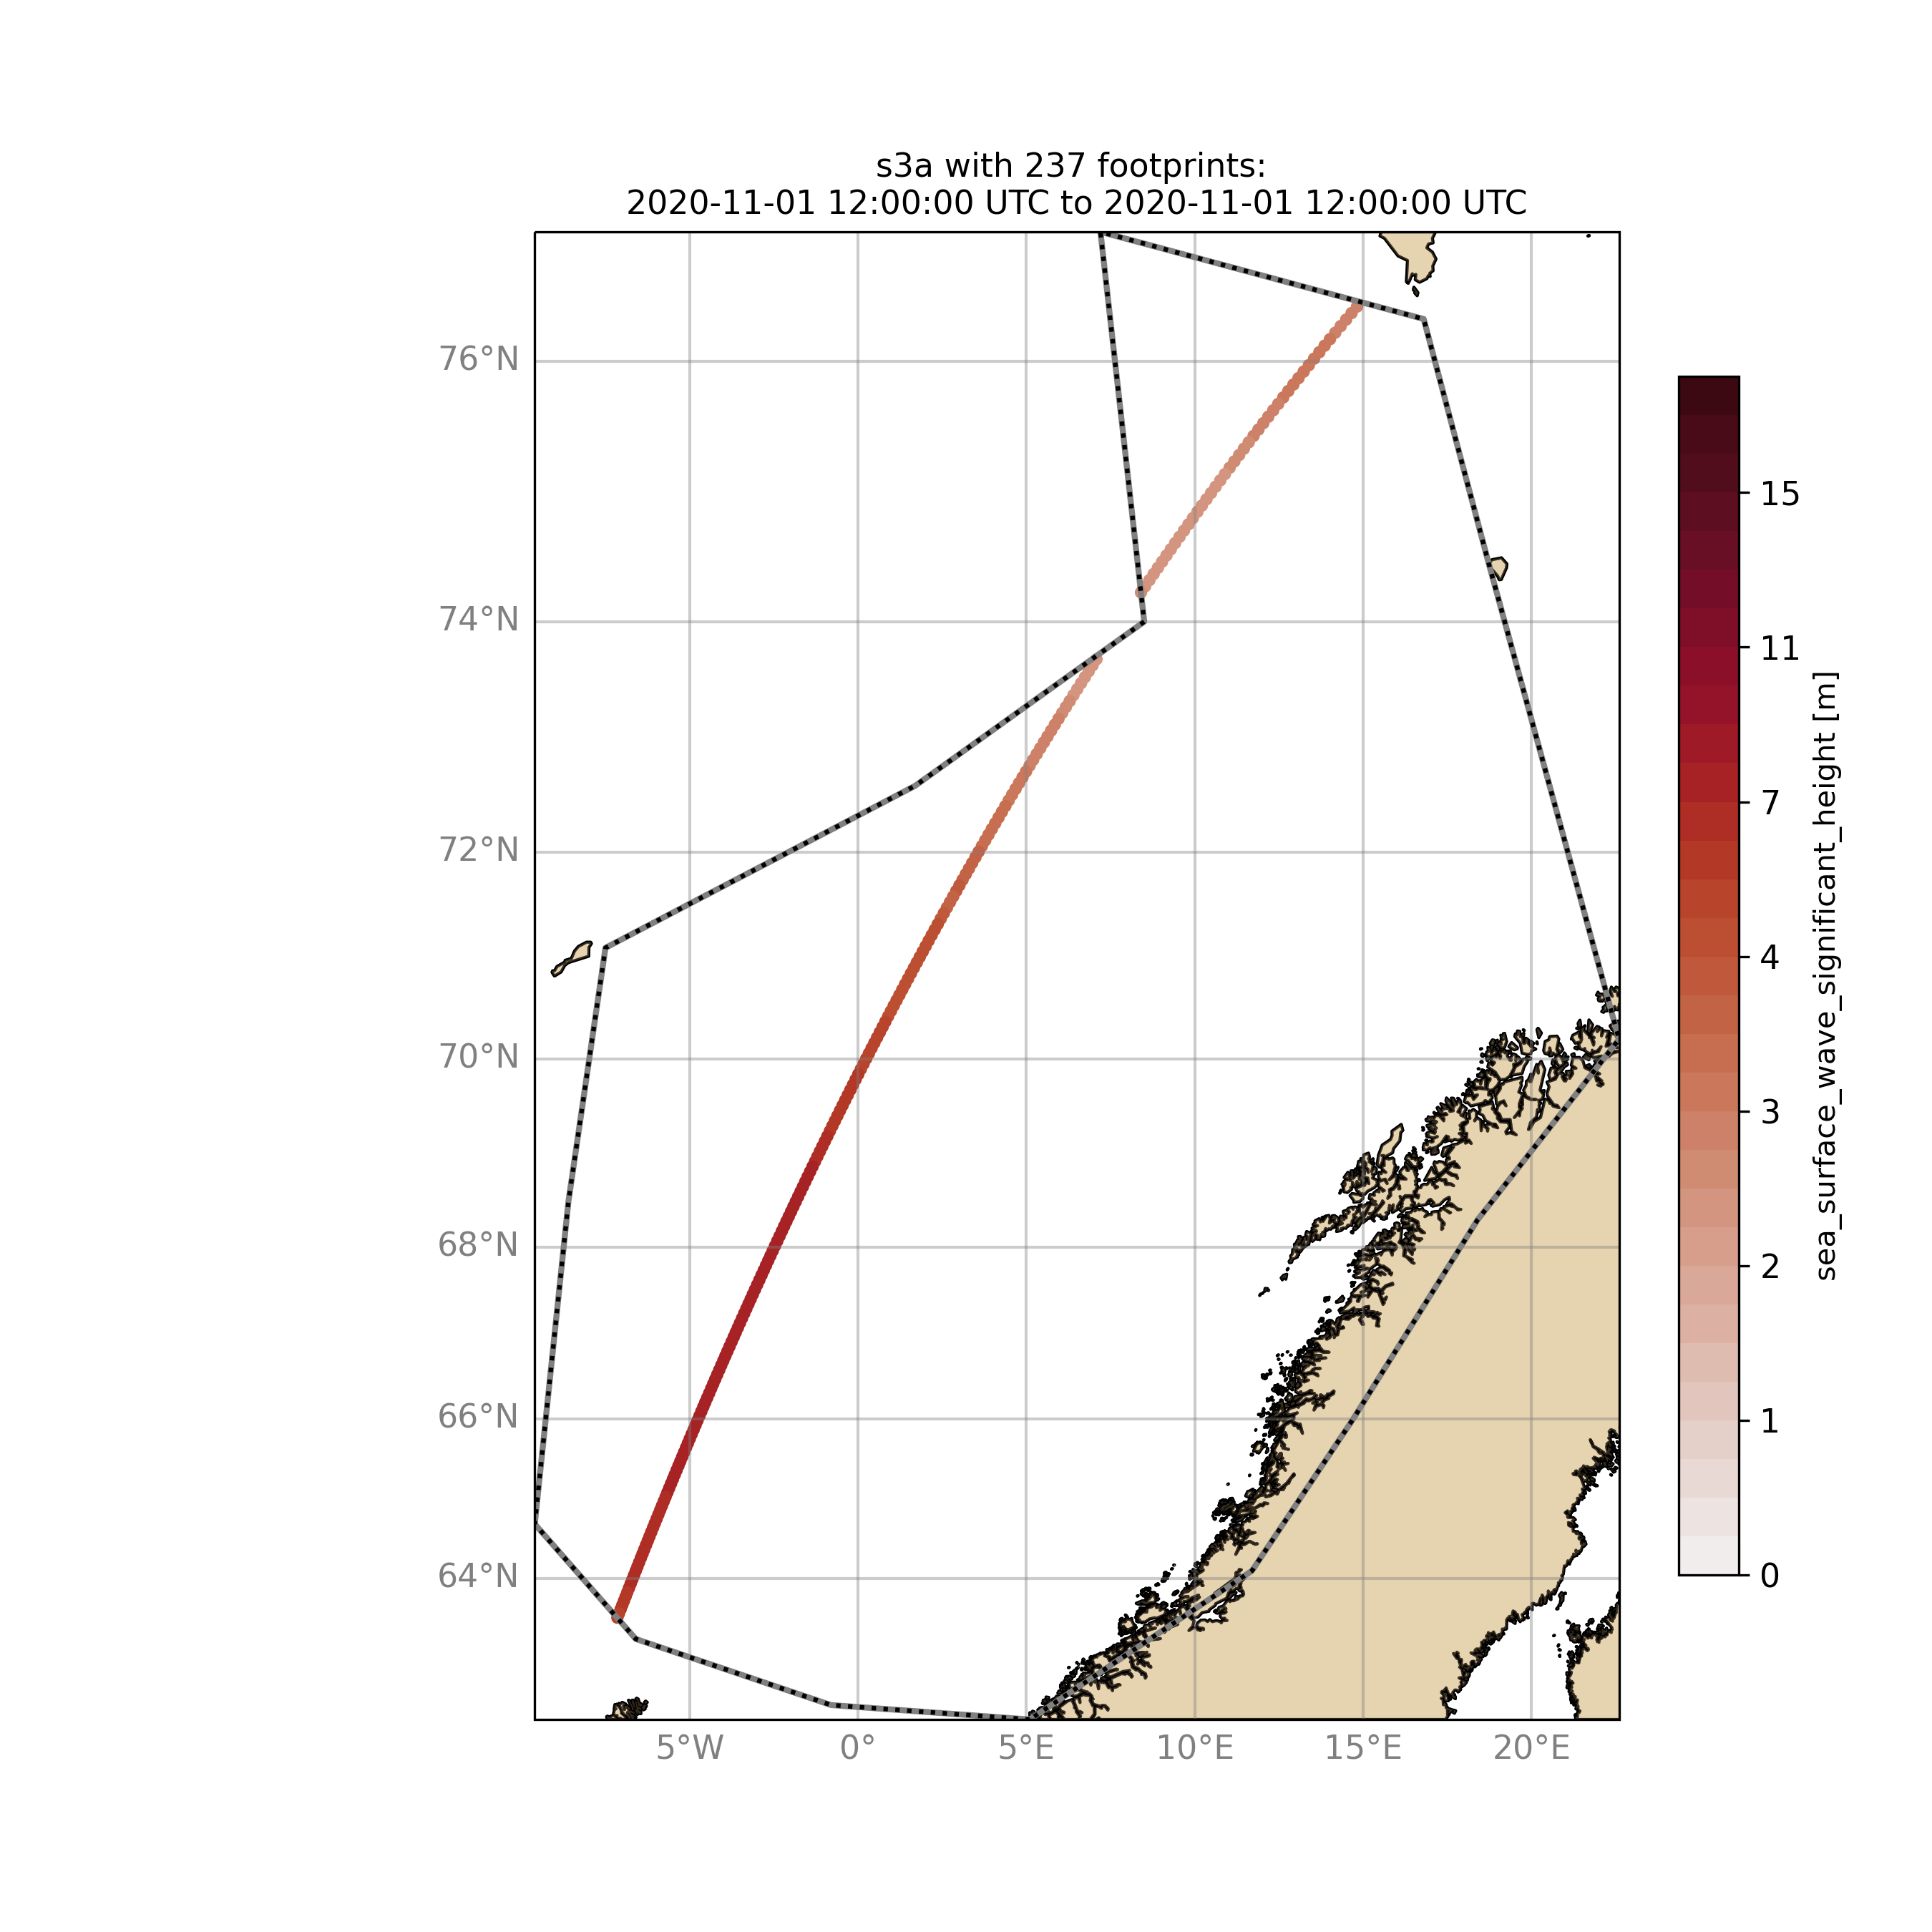
or for a user-defined polygon
$ ./wavyQuick.py -sat s3a -reg NorwegianSea -sd 2020110112 --show
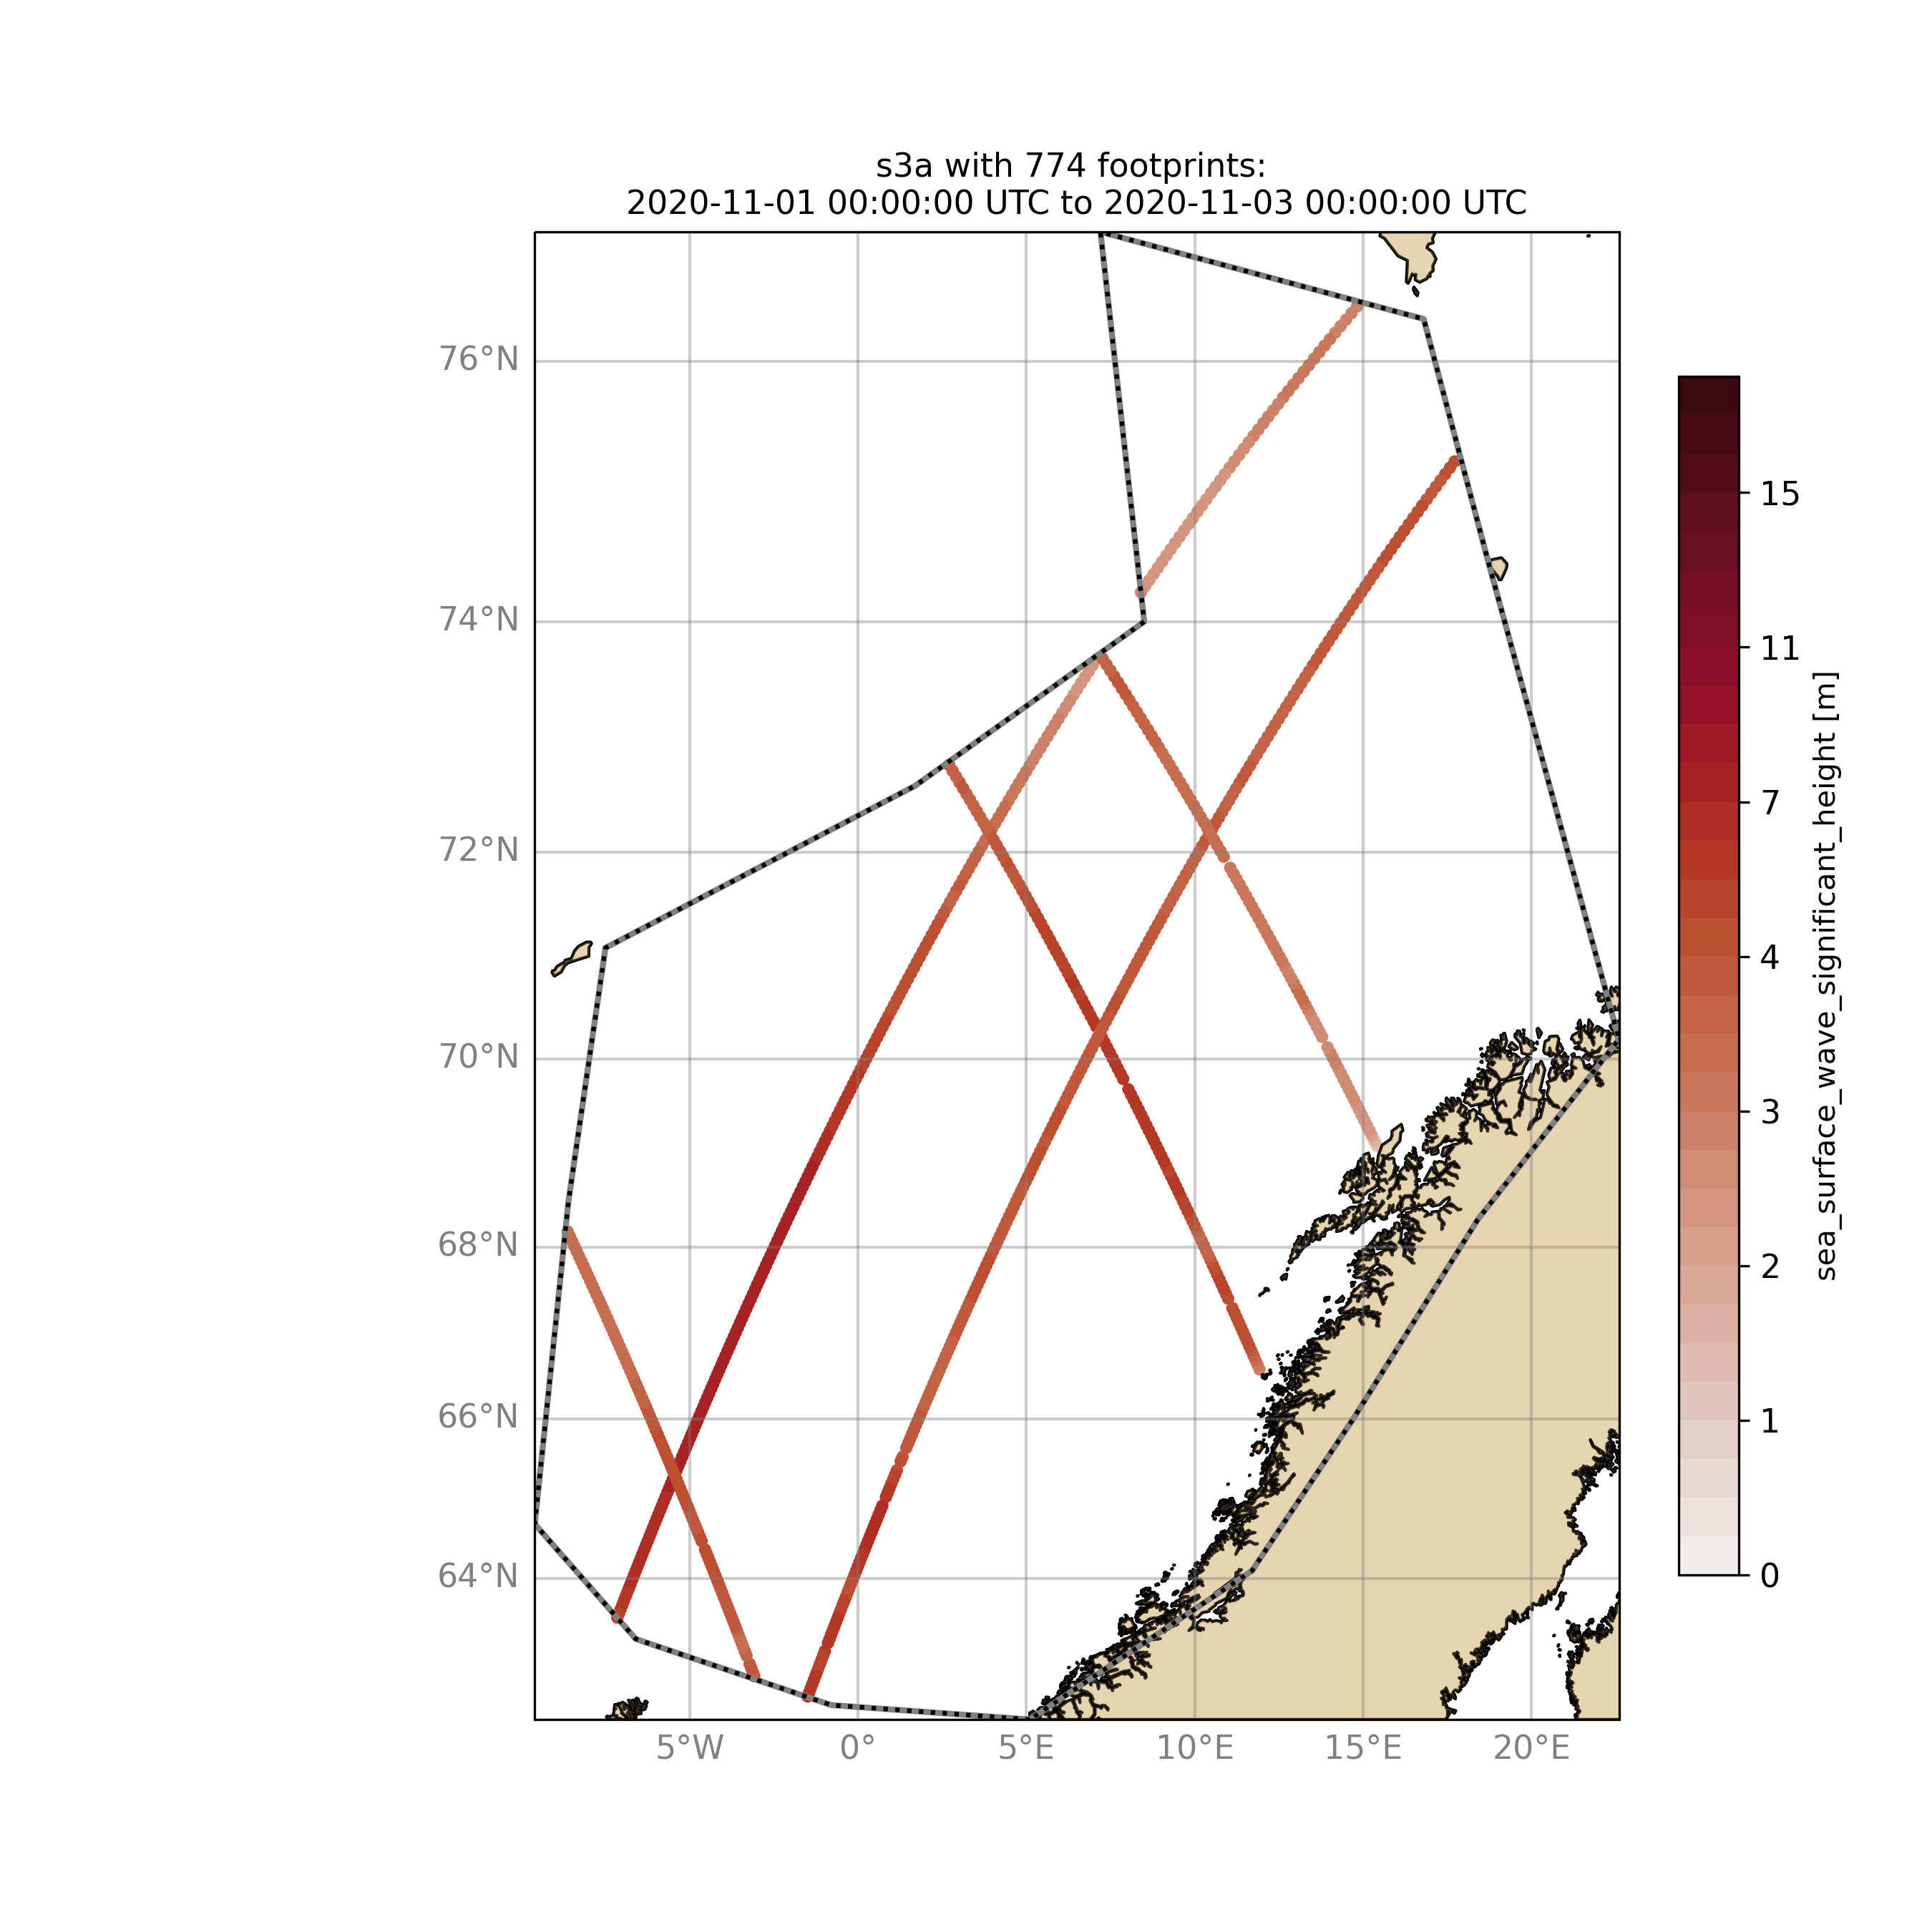
Browsing for satellite data and show footprints on map for time period would be the same approach simply adding an ending date:
$ ./wavyQuick.py -sat s3a -reg NorwegianSea -sd 2020110100 -ed 2020110300 --show
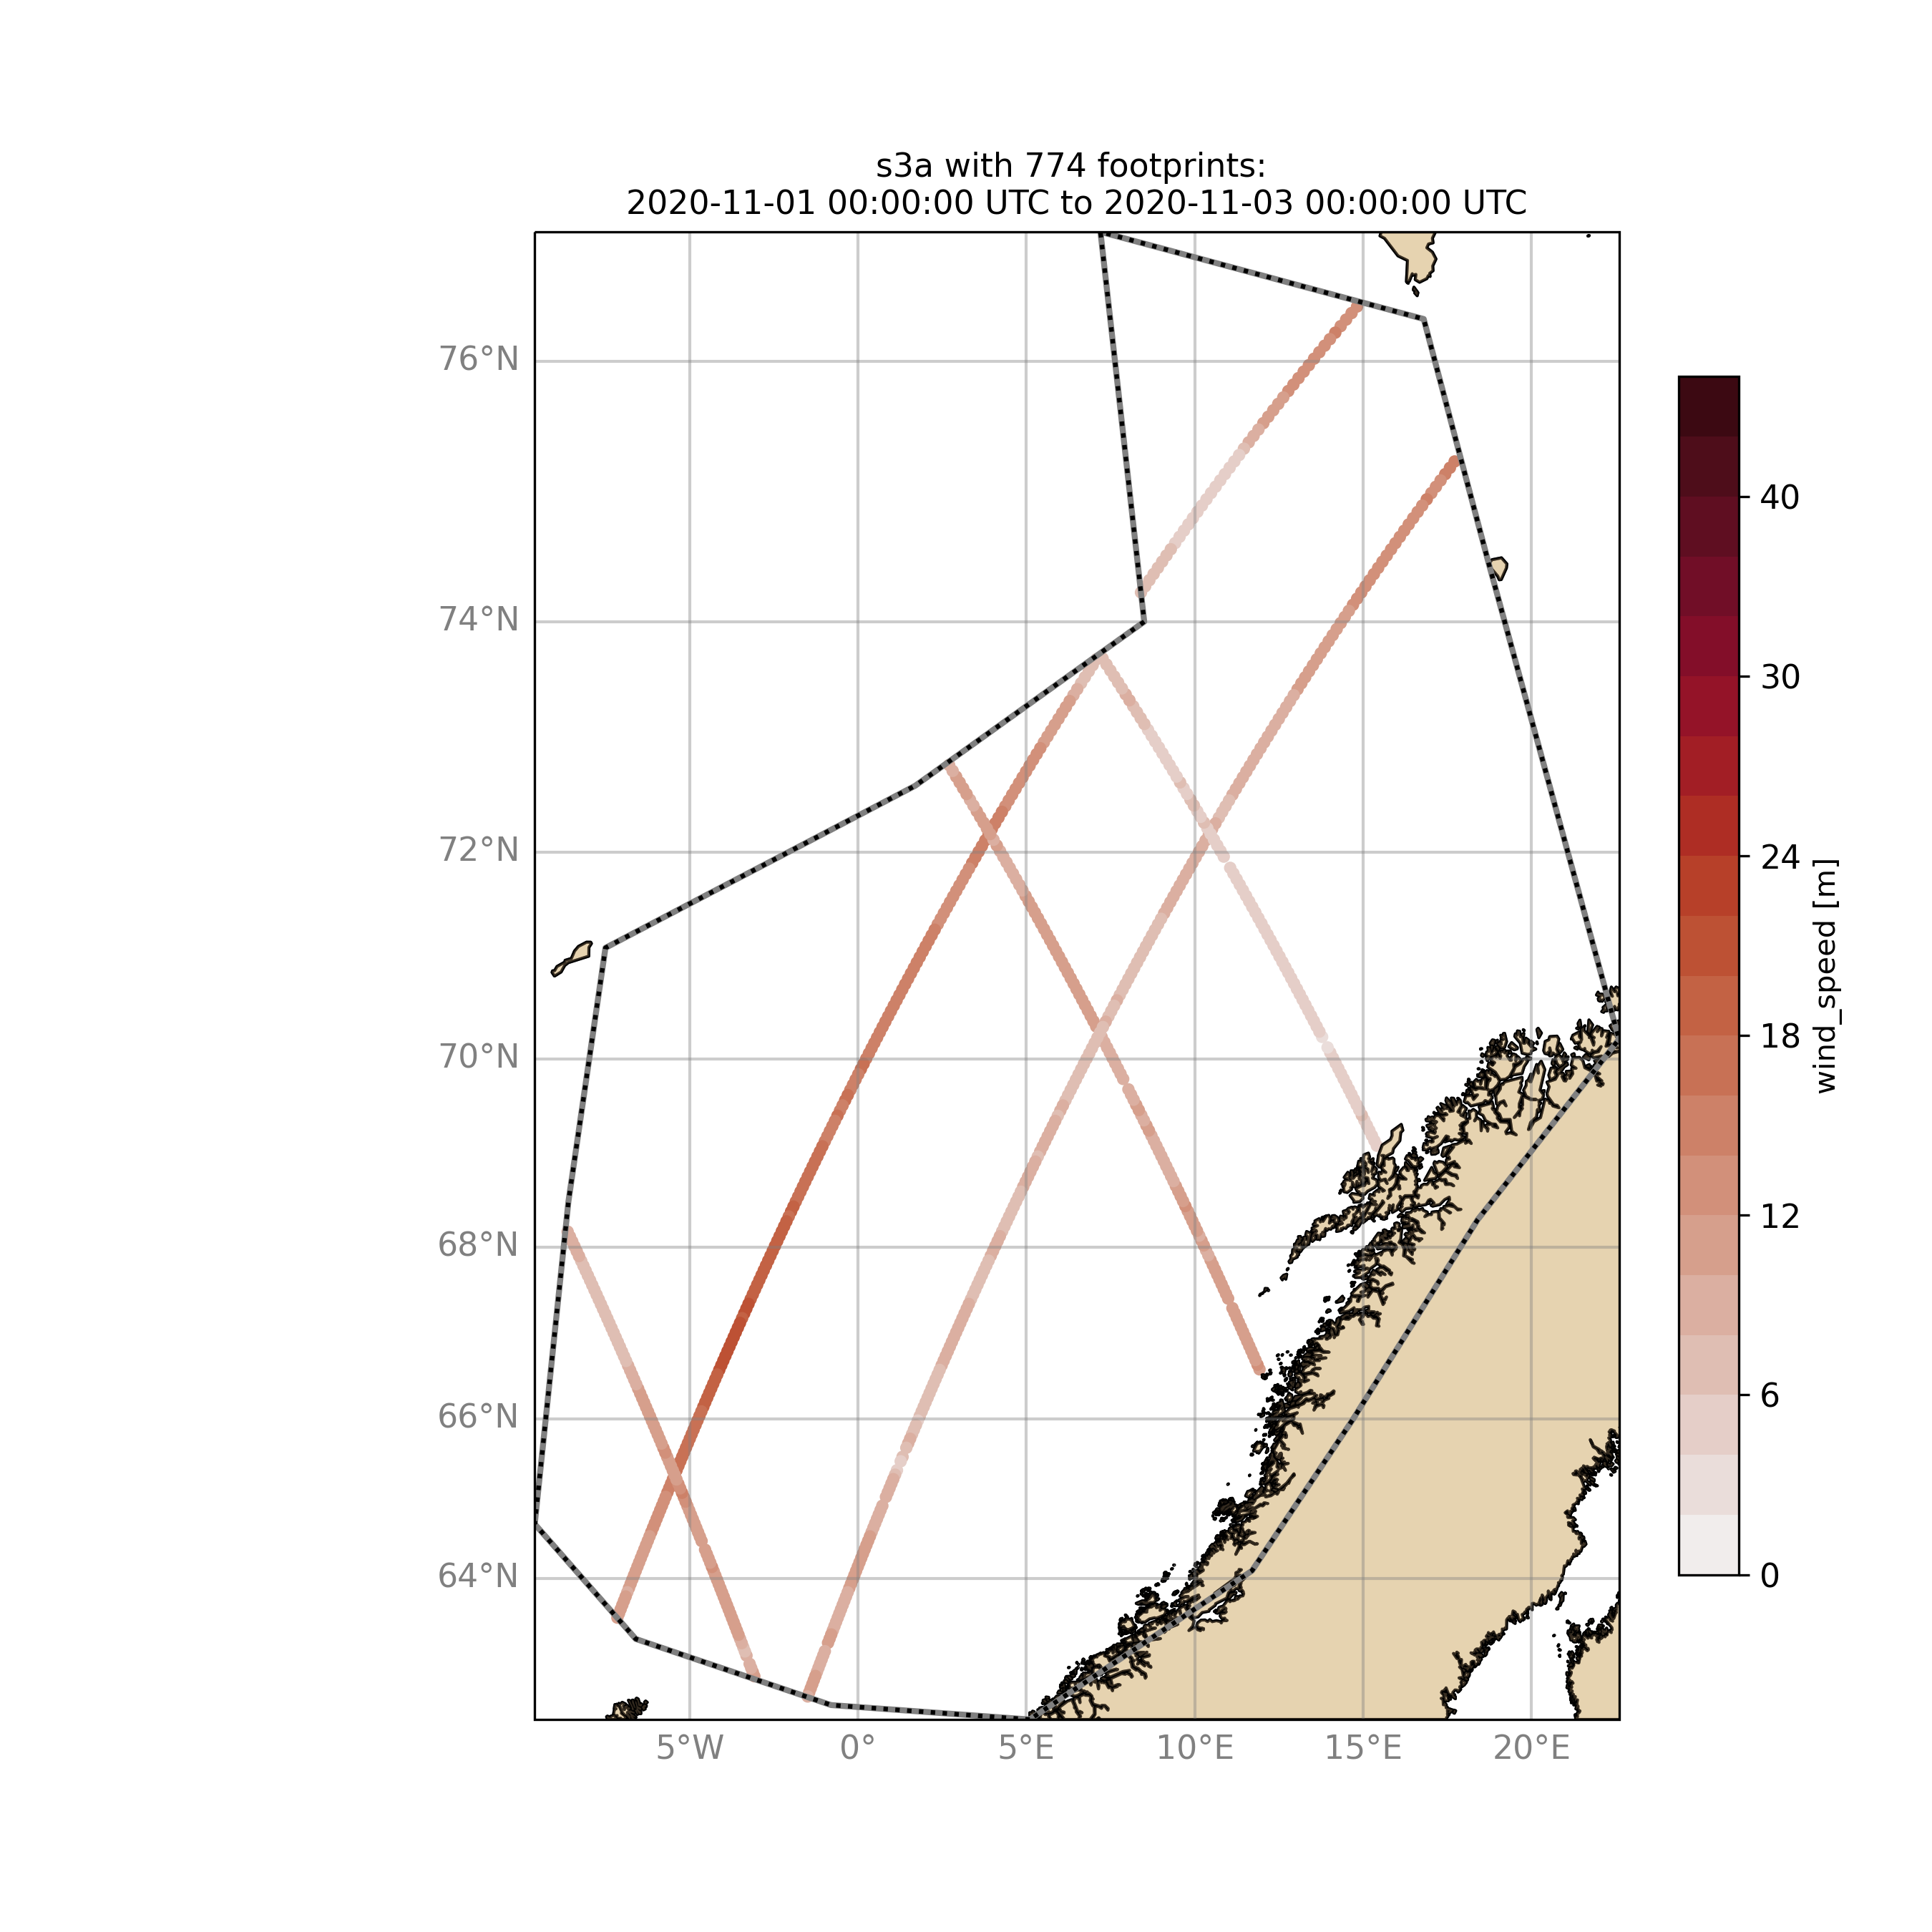
The same could be done choosing 10m wind speed instead of significant wave height:
$ ./wavyQuick.py -var U -sat s3a -reg NorwegianSea -sd 2020110100 -ed 2020110300 --show
The -sat argument can also be a list of satellites (adding the -l argument) or simply all available satellites:
$ ./wavyQuick.py -sat list -l s3a,s3b,al -mod mwam4 -reg mwam4 -sd 2020110112 -lt 30 -twin 30 --col --show
$ ./wavyQuick.py -sat all -mod mwam4 -reg mwam4 -sd 2020110112 -lt 30 -twin 30 --col --show
Now, dump the satellite data to a netcdf-file for later use:
$ ./wavyQuick.py -sat s3a -reg mwam4 -sd 2020110100 -ed 2020110300 -dump /home/patrikb/tmp_altimeter/quickdump/test.nc
Browse for satellite data, collocate with wave model output and show footprints and model output for one time step and a given lead time (-lt 0) and time constraint (-twin 30):
$ ./wavyQuick.py -sat s3a -reg NorwegianSea -mod mwam4 -sd 2020110112 -lt 0 -twin 30 --col --show
This results in a validation summary based on the collocated values:
# ---
Validation stats
# ---
Correlation Coefficient: 0.95
Mean Absolute Difference: 0.62
Root Mean Squared Difference: 0.70
Normalized Root Mean Squared Difference: 0.13
Debiased Root Mean Squared Difference: 0.67
Bias: 0.22
Normalized Bias: 0.04
Scatter Index: 12.71
Mean of Model: 5.26
Mean of Observations: 5.04
Number of Collocated Values: 237
And of course the figure:
